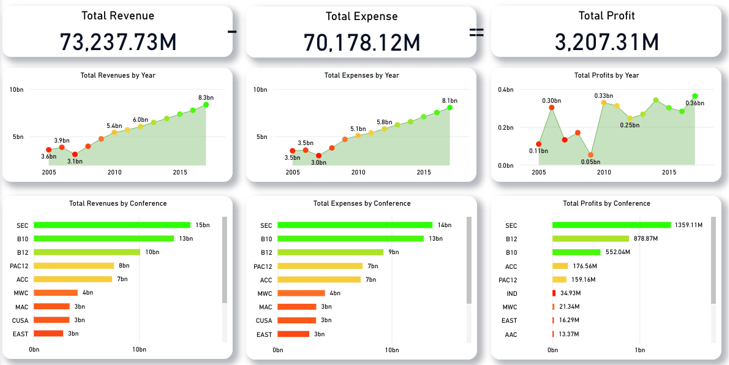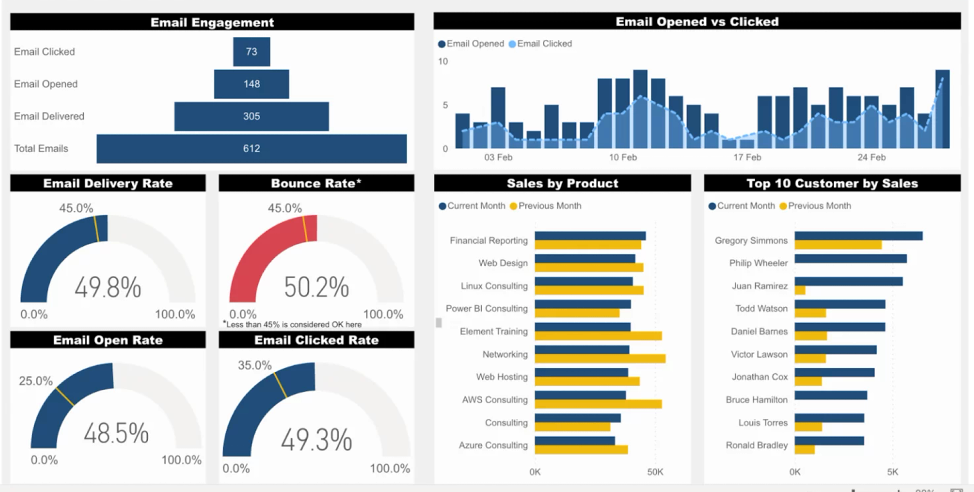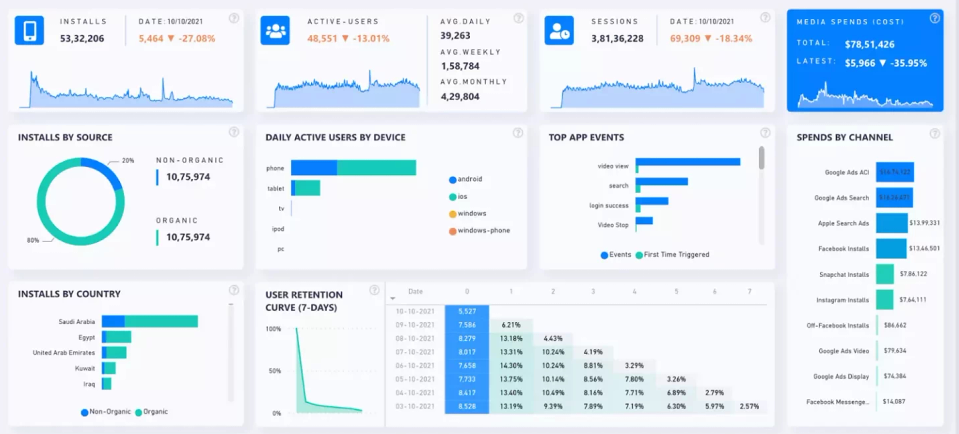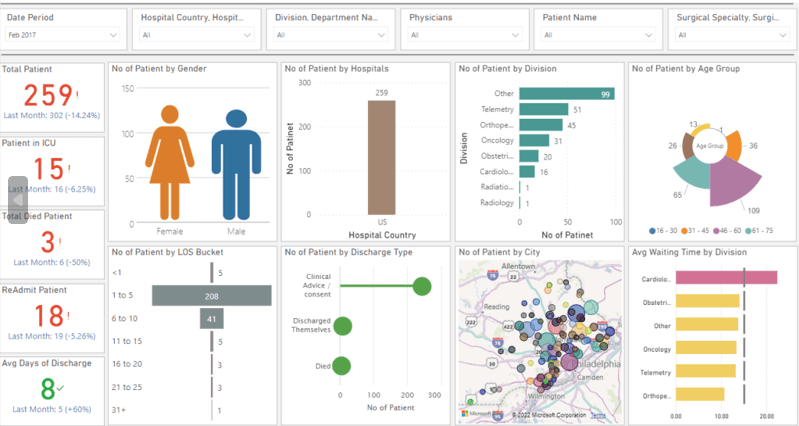
What is Microsoft Power BI?
- Power BI is a business intelligence tool created by Microsoft that allows users to analyze and visualize data in a user-friendly way.
- It is designed to help managers make data-driven decisions and Power BI is a versatile tool that empowers users to harness the power of data for decision-making, reporting, and data visualization. It’s a valuable tool in various industries, including Marketing, Finance, Sales, HR, and Operations.
Why Power BI is the best solution for your business?
- Power BI is the most powerful suite of business intelligence and analytics tools on the market.
- It can natively connect to hundreds of different data sources.
- Deliver valuable insights to your organization.
- It gives organizations, from the executive leadership down to individual users, more control over how their data is used.
- Power BI is a comprehensive solution that produces a more secure and collaborative data environment.
- Drives actionable insights and will help put your organization ahead of the competition.
- Power BI can give any organization complete control over all its data.
- Helping to drive more valuable insights and empower employees to meet and even exceed their goals.
- Stop worrying about your data’s security. With more data controls, as well as Microsoft’s secure Azure infrastructure, you can rest easy. It saves you both money and time.
- In the world of online gaming, platforms like Lucky Wins Casino leverage the power of advanced analytics tools such as Power BI to transform raw data into meaningful insights. By harnessing the capabilities of Power BI, decision-makers at Lucky Wins Casino can analyze player behavior, monitor gaming trends, and optimize their offerings, ultimately enhancing the overall player experience. This data-driven approach not only helps in identifying opportunities for growth but also enables the casino to make informed decisions that lead to increased player engagement and, consequently, more successful outcomes. Through effective data visualization and reporting, Lucky Wins Casino positions itself to achieve greater success in the competitive online gaming market.
- Power BI is a popular and highly capable BI tool that offers a range of features and benefits, including affordability, ease of use, scalability, and robust security features.
Aspects and benefits of Power BI:
- Power BI provides a user-friendly interface for creating interactive and visually appealing charts, graphs, and dashboards. Users can easily drag and drop data to create informative visualizations.
- Users can connect Power BI to various data sources such as Excel spreadsheets, databases, cloud services, and online platforms to consolidate data from different places into one central location.
- It enables users to explore and filter data to discover insights and trends. You can simply click, filter, and drill down to explore data.
- Power BI offers collaboration features, allowing multiple users to work on the same dataset or report simultaneously. This promotes teamwork and knowledge sharing.
- Power BI can be used in the cloud, making it accessible from anywhere with an internet connection. Additionally, there are mobile apps available for on-the-go data access and analysis.
Real-Time Information
You can set up automatic data refresh so dashboards are updated in real time. This gives users the ability to solve problems and identify opportunities quickly.
Customizable Dashboards
Powerful personalization capabilities allow users to create dashboards which can be customized to meet the exact need of any organization.
Affordable & Inexpensive
Power BI is relatively inexpensive and affordable for small businesses. Power BI Pro costs as low as $9.99 USD or $12.80 CAD per user per month. You can also download the free version, Power BI Desktop.
Seamless Integrations
Power BI can integrate with existing Microsoft applications such as Office 365, Dynamics 365, and Sharepoint as well as other non- Microsoft products like Google Analytics, Salesforce, and more.
Monthly Updates
As a cloud-based platform, Power BI Pro is constantly making updates to offer users advanced business intelligence features to help make more accurate business decisions.
Powered By Al
Built-in machine learning features can analyze data and help users spot valuable trends and make educated forecasts and predictions.

These are powerful tools from Microsoft for creating business solutions that we can connect to the Power BI tool, and we can use them with the same user who has the authority to use the Power BI without the need to purchase licenses.
Power Automate is a tool from Microsoft that lets users automate tasks and processes within their Office 365 workflow. Microsoft Office 365 has a wide range of apps that are essential to business operations. We can use Power Automate to send alerts from Power BI reports and there are many advantages between Power Automate and Power BI.
Power Apps is a tool from Microsoft, we can create applications using Power Apps and link the application with Power BI reports so that the application data is directly reflected in the report and displayed in reports.
Just Look At The Numbers
100,000+ companies currently use powe BI
Millions od active users
Used in over 200 countries
More than 500 diffrent partners in its ecosystem
Types of Outputs:
Dashboard

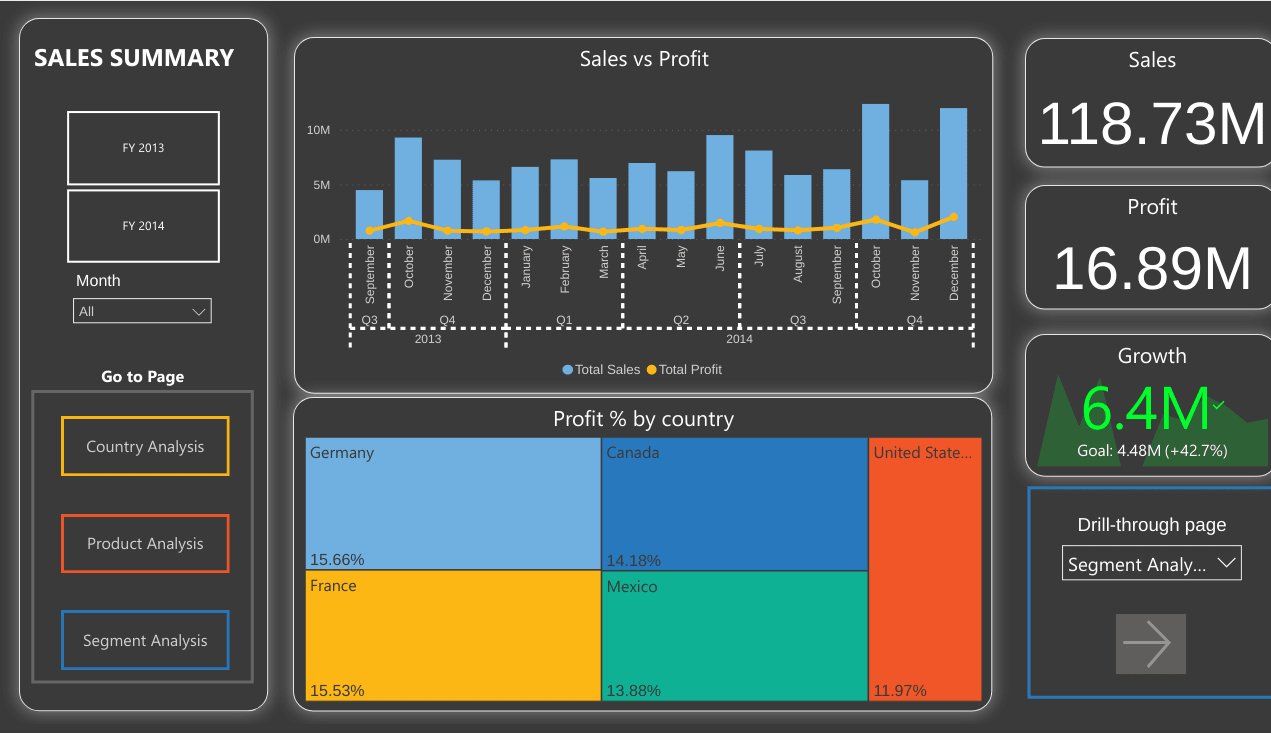
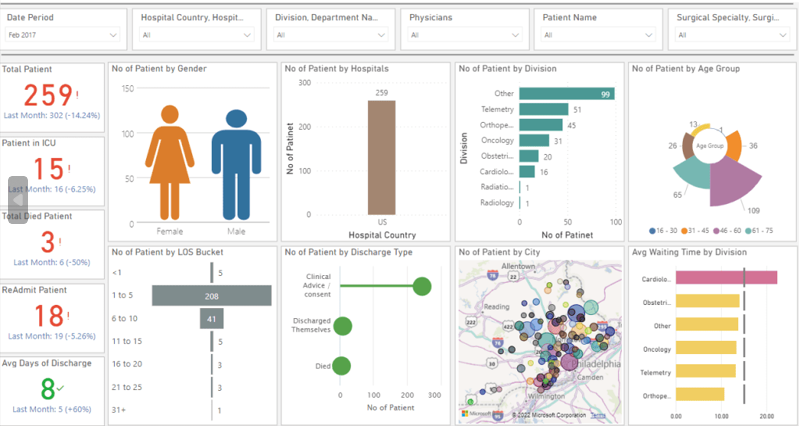
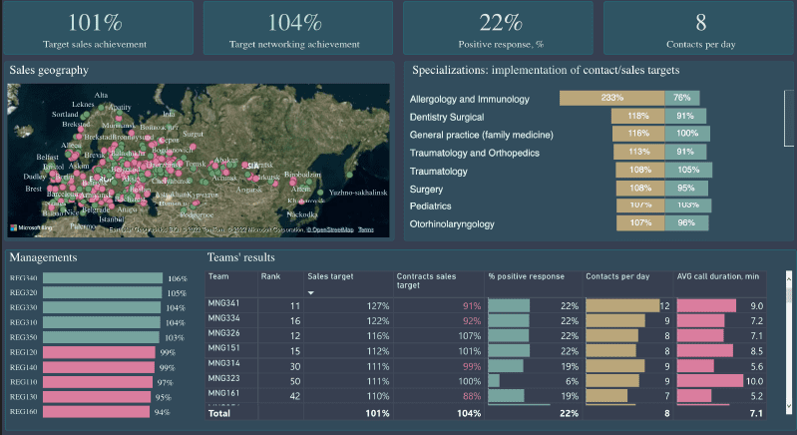
executives work with dashboards, analysts work with analytical reports, and information workers work with operational reports. The goal of the dashboard is to interpret the story as quickly as possible. It must be self-explanatory and clearly labeled showing high-level metrics in one page.
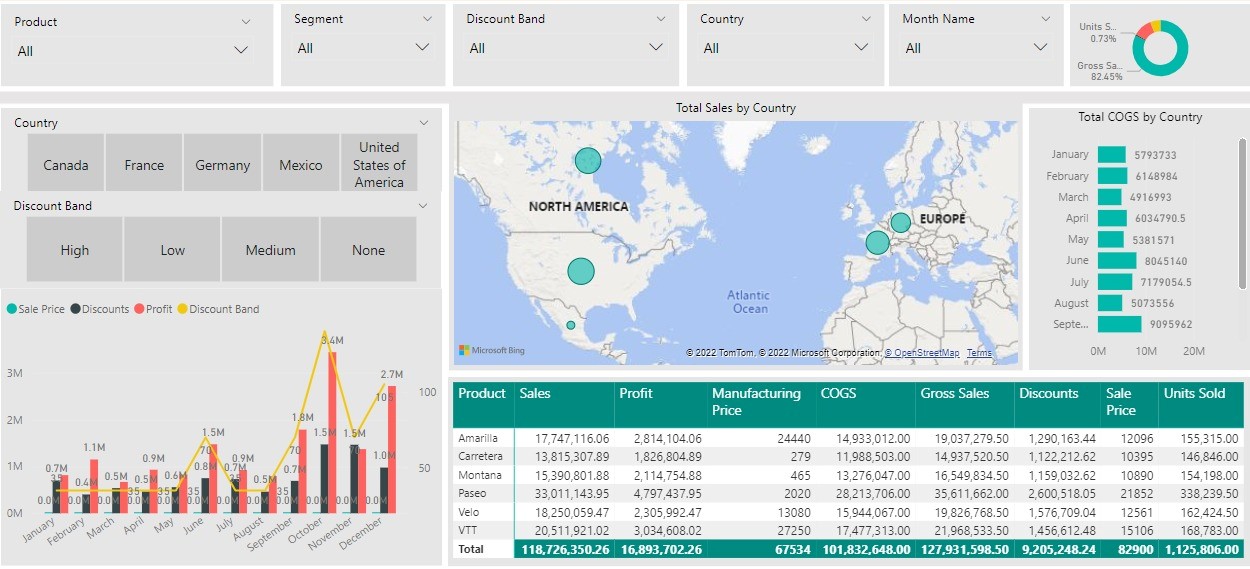
Analytical report
This is the most common type of report that can be used by many consumer use cases. The goal of an analytical report is to answer question by interacting with the provided visuals, it offers slicers to filter the data.

